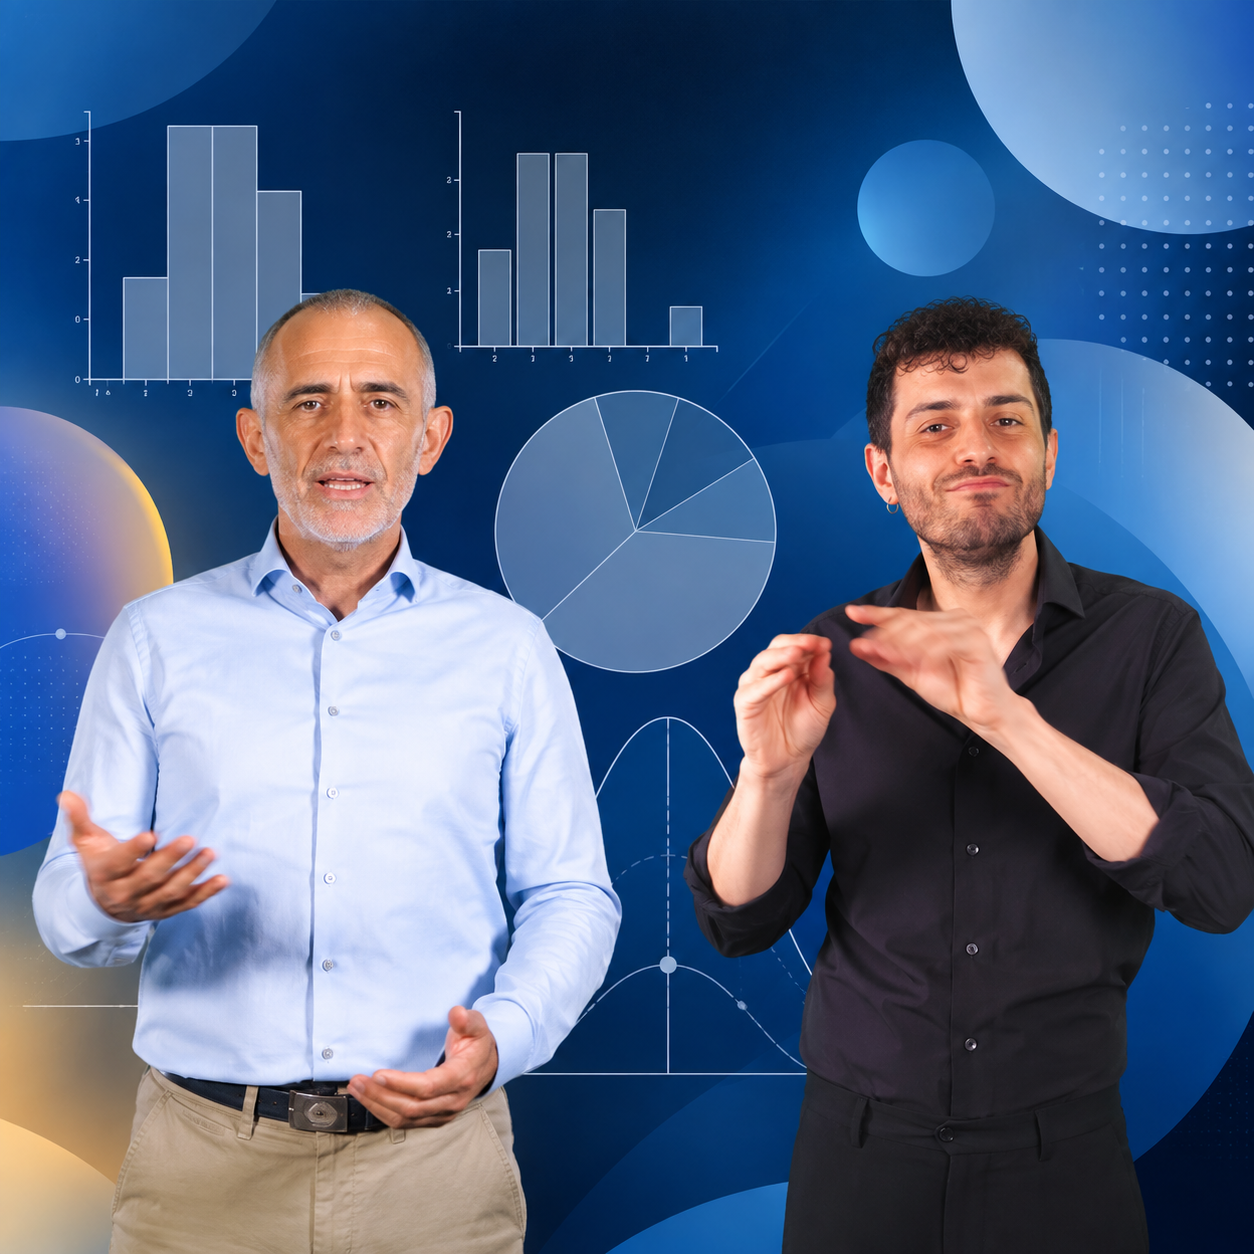
The first video lessons of “Matematica Accessibile” (Accessible Mathematics) are now online. The project was created by Professors Guatteri and Gregoratti from the Department of Mathematics at Politecnico di Milano and is dedicated to the development of highly accessible mathematics video lessons for deaf students in upper secondary schools.
Why Accessible Mathematics?
The project was developed in response to the difficulties that deaf students typically begin to encounter in mathematics during upper secondary school. As mathematical concepts become increasingly complex and abstract, explanations play an ever more important role. However, without dedicated teaching tools and integrated communication methods, these explanations may not be fully accessible to deaf students.
This can affect their educational development, including their future university choices. The project provides support to make the study of mathematics more accessible to deaf students.
How are the video lessons designed?
The video lessons combine spoken explanations, Italian Sign Language (LIS), subtitles and visual content. They are designed in particular for deaf students, but can also be used by hearing students. Students can choose to follow:
- the teacher’s voice;
- lip-reading;
- subtitles;
- Italian Sign Language (LIS).
In addition, the board is used to visualize and summarize concepts, as well as to show calculations and mathematical steps.
These different modes allow students to follow the explanation through the channel, or combination of channels, that best suits their needs.
Not only for deaf students
The video lessons are designed:
- for deaf students, as an accessible learning resource;
- for all students, as additional study material;
- for mathematics teachers and support teachers, as a resource to facilitate communication and teaching;
- to show how designing for accessibility can result in tools that benefit a wider audience.
The first lessons are now available!
The first set of video lessons available online focuses on Statistics. The course covers frequency tables and graphs, measures of central tendency, and measures of variability.